Different types of inflation explained
By Sam Slator on 18 March 2022 in Basics

How much???
Whether it’s the price of fuel at the petrol station, a new pair of trainers, or the fact that a Freddy Frog chocolate bar is no longer 30p but 68p (no, really!), we’ve all expressed shock about how much more expensive something has become.
And that, my friend, is inflation. Expressed as a percentage, inflation is a measure of how much the prices of goods and services have gone up over time. By goods we mean items such as food, televisions or even cars. Services, meanwhile, include everything from beauty treatments to train tickets.
It’s looking at how much these things cost today, compared with 12 months ago. So, when inflation is 4%, it means prices are 4% higher than the previous year.
Low inflation for a generation
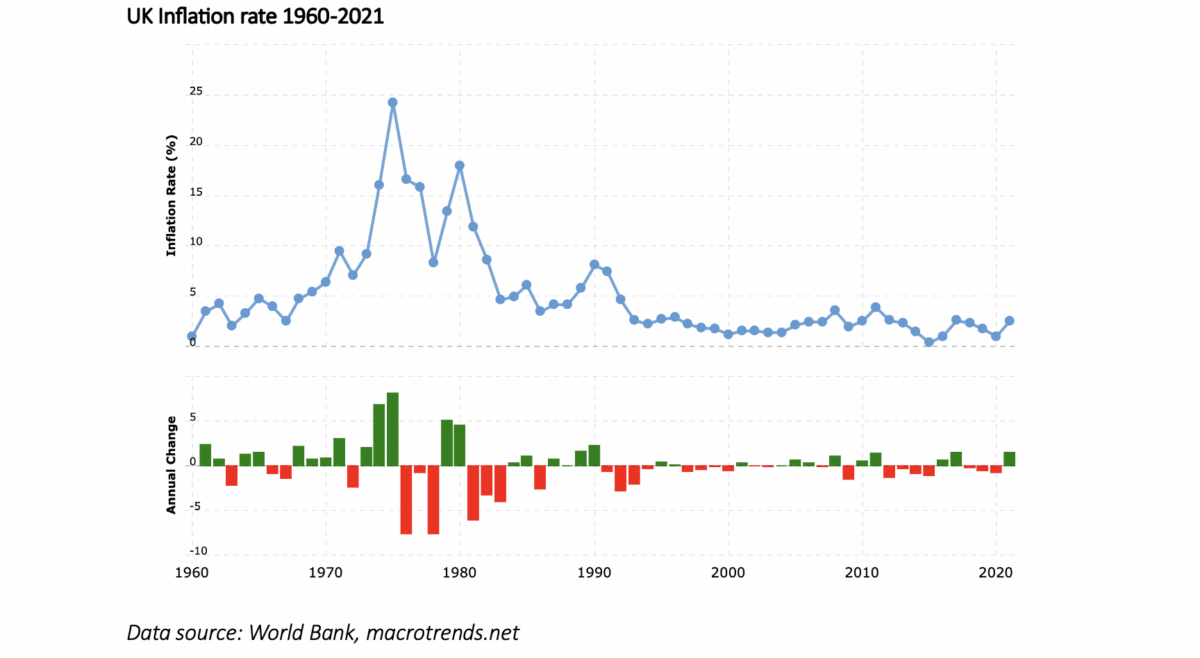
As a term, inflation went pretty much undetected between the early 1990s and 2020s. It ran at about 1%-3% and no one really noticed things getting gradually more expensive. But Baby Boomers and Gen X will remember it was a problem in the 1970s and 1980s, when it spiked to over 25%! Imagine that – the price of everything going up by a quarter in a year!
Then along came 2022 and suddenly inflation became a headline grabber once again. As the price of coffee and skin care sky-rocketed, Millennials and Gen Z quickly googled or consulted TikTok about the phenomenon.
How is inflation measured?
So, how does everyone know the amount by which prices have risen? In the UK, this is a job for the Office for National Statistics (ONS). The ONS is the largest independent producer of official statistics and is responsible for collecting and publishing information relating to the economy, population, and society.
Every month, the ONS collates around 180,000 prices of 700 items. This is referred to as the ‘shopping basket’ and is supposed to represent a typical family’s spending.
As you can imagine, this shopping basket changes over time.
After the First World War, it contained things like a man’s brace set, corned beef, candles, and coal. By the 1960s, rabbit was out, and chicken was in. Frozen chips had been added and TVs joined football admission as part of our leisure spending. The 1980s saw fizzy drinks added along with pet food and DIY materials, while this year (2023) saw the addition of e-bikes, security cameras and frozen berries.
But by comparing movements in the cost of this basket year after year, the ONS can calculate what is known as the Consumer Prices Index, or CPI. This is used as the measure of inflation.
What is the inflation target?
The ideal scenario is for inflation to be low and stable. When it’s running at a high level, it means that incomes can’t keep pace with the rising costs of living – hence the cost-of-living crisis in 2022 and 2023. This is why the UK Government sets the Bank of England the target of keeping inflation at 2%.
Traditionally, the Bank’s way of controlling inflation is through interest rates. This means the cost of borrowing goes up and that has the effect of stopping people spending so much.
It takes time for interest rate rises to have the necessary effect, however. 12-18 months according to Richard Woolnough, manager of the M&G Optimal Income fund.
And there is no guarantee that it will fall back to its long term average. “4% is the new 2%” according to Dr Niall O’Connor, manager of Brooks Macdonald Defensive Capital, who thinks inflation will remain above target for many months to come.
The impact of inflation
As we all experienced in 2022/2023, an inflationary environment generally means we still have the same amount of money to spend but it doesn’t go as far because everything is more expensive. This affects our purchasing power.
It means weekly trips to the supermarket will cost more for exactly the same items, while rising fuel prices sees drivers having to pay extra to fill up their tanks.
We examined how prices in the UK have changed over time by using the Bank of England’s inflation calculator. For example, something that cost £10 back in 1950 would now be £276.15!
You can even see the increases over the last five years. You would have needed to pay £12.17 in 2023 for an item that would have been sold for £10 in 2018.
Different types of inflation
Economists will declare there are different types of inflation. The most common forms you may hear about are demand-pull and cost-push.
Demand-pull is when there is more demand for goods than there is supply. This is often seen as a healthier type of inflation as it’s caused by higher employment and wages. It can also be caused by supply shortages however, as we saw after the global pandemic in 2020.
Cost-push inflation, meanwhile, occurs when the cost of making goods increases and companies have to raise their prices in order to cover the shortfall. However, this can obviously put a strain on the consumer.
There is also the concept of built-in inflation. This is when expectations of future inflation actually end up causing inflation itself.
The idea is that as prices rise, workers demand higher wages to help them cover the spiralling costs. In turn, this causes production costs to rise, which can lead to prices going up again and so on.
What is disinflation?
Disinflation is still a period of inflation, but prices are rising by smaller amounts than they were before. In other words, the rate of inflation is falling.
In some cases, disinflation can suggest unemployment is rising or economic growth is slowing. It can also come about when central banks raise interest rates.
What is deflation?
The opposite of inflation is deflation. This is when the percentage measure of inflation drops below zero, meaning goods and services become cheaper.
On the face of it, this sounds great, right? If everything is less expensive it should mean that you can afford to buy more items – including those that were previously out of your budget.
However, it’s not quite that straightforward.
The issue is that, because the value of your cash increases, you are more incentivised to hold onto your money rather than spend it. Also, when prices fall there is the expectation that this will continue, and a coveted item may be even cheaper tomorrow. As a result, people hold off on making a purchase.
A downside of fewer products being bought is companies’ revenues falling. This can lead to higher rates of unemployment as businesses are forced to cut costs. The subsequent continued downturn in spending is known as a “deflationary spiral”.
What is stagflation?
Stagflation occurs when there is no economic growth and unemployment is rising, but there is still inflation in the system. In other words, your wages would be falling, but the price of goods would keep rising. It’s not an ideal environment for anybody! Stagflation tends to be the result of ‘bad’ or ‘cost-push’ inflation.
What is reflation?
Reflation essentially signifies the start of the inflationary cycle after a recession. It is often regarded as the opposite of disinflation. It shouldn’t be confused with full-blown inflation, which we have already outlined, as it tends to happen more gradually.
Reflation occurs when the economy starts to experience stronger growth in conjunction with rising prices. This can be caused by central banks injecting more cash into the economy through actions such as reducing taxes, printing money, or lowering interest rates.
The idea is that as economic growth improves, demand for goods increases, companies make more products, and more staff get hired. Another positive of this backdrop is that it should lead to higher wages as companies continue to thrive.
Reflation also benefits the government because, as corporate profits improve and more people return to the workforce, they receive more tax revenue. As an added bonus, the government should also spend less money as benefit payments fall.
If you want to find out more about how inflation impacts your investments, try reading ‘what high inflation means for your finances‘ or ‘how to inflation-proof your ISA portfolio’
This article was originally published 13 March 2018. It was updated on 16 July 2020, 18 March 2022 and 2 May 2023.
This article is provided for information only. The views of the author and any people quoted are their own and do not constitute financial advice. The content is not intended to be a personal recommendation to buy or sell any fund or trust, or to adopt a particular investment strategy. However, the knowledge that professional analysts have analysed a fund or trust in depth before assigning them a rating can be a valuable additional filter for anyone looking to make their own decisions.
Past performance is not a reliable guide to future returns. Market and exchange-rate movements may cause the value of investments to go down as well as up. Yields will fluctuate and so income from investments is variable and not guaranteed. You may not get back the amount originally invested. Tax treatment depends of your individual circumstances and may be subject to change in the future. If you are unsure about the suitability of any investment you should seek professional advice.
Whilst FundCalibre provides product information, guidance and fund research we cannot know which of these products or funds, if any, are suitable for your particular circumstances and must leave that judgement to you. Before you make any investment decision, make sure you’re comfortable and fully understand the risks. Further information can be found on Elite Rated funds by simply clicking on the name highlighted in the article.
Related insights

Five reasons why now could be the right time to revisit bonds

Designing a long-term ISA portfolio that works
Designing an ISA that evolves with you