

Value has awoken from its slumber – but how much value is left in the tank?

“Value is not dead, it is just sleeping”. This was our retort in 2019 when major questions were being asked about one of the most popular strategies in the second half of the 20th century.
There is no doubt the 2010s were unkind to value investors. This has been attributed to the low interest rate environment that prevailed after the global financial crisis, coupled with the underpinning of markets courtesy of quantitative easing.
Between 2010 and 2020, a prolonged downturn saw many value funds either disappear or be restructured amid a major lack in demand. But investors often ignore the long term, with figures from JPMorgan showing value outperforming growth by 260% between 1974-2007*.
The past five years have seen the beginning of a change in momentum. Following one of the longest and strongest growth cycles in history, valuation spreads between value and growth reached record highs. Then COVID-19 struck, halting economic activity and hitting cyclical value stocks hardest. Meanwhile, tech stocks soared, pushing valuation spreads to unprecedented levels.
The current value cycle began later in 2020, as markets (and value in particular) rebounded from depressed levels. It’s been an unusual cycle, coinciding with the AI boom that’s driven outsized returns for mega-cap growth stocks. This, among other distortions, has made the value rally vary significantly by region.
It has been something of a seesaw. We have seen growth rebound on the back of the unprecedented returns from the Magnificent Seven tech stocks. But 2025 has been more value driven as events like tariffs have pushed investors towards value. Essentially they favour relatively higher earnings today over uncertain future growth potential.
Year-to-date, value stocks globally have outperformed growth (9.6% vs. 4%)**, while over the past five years, they are neck and neck (81.2% value vs. 80.5% growth)***. Value rallies have historically been quite sharp and aggressive in recent history but, with higher rates and inflation, it has been more prolonged on this occasion.
Value sector has evolved
Another common assumption is that value stocks are generally limited to mature, cyclical sectors, such as financials, energy, materials, and industrials — all of which are often characterised by low P/E ratios, stable cash flows, low growth rates, and high dividend yields. But research from Wellington shows that value is not tied to just certain parts of the economic cycle****.
It states: “The performance of value stocks is not necessarily aligned with the economic cycle. In different periods, inflation, real rates, and GDP can contribute to the value/growth cycle. In addition, the sector composition of the value stock universe is more diversified than in the past, with technology, health care, and other traditionally growth-oriented sectors now better represented.”
Figures from 2024 show value’s largest weights in the Russell 1000 value indices were healthcare (16%) and financials (20%), followed by industrials (15%), IT (13%), and consumer staples (9%). Energy is only at 7%. This is a very different mix when compared to a decade ago, when energy and financials made up 13% and 25% of the value index****. For those who are wondering, IT exposure comes from industries such as hardware, semiconductors, IT services, and communications equipment, rather than software companies, which are more likely to be found in the growth index.
What we have seen is that the strong advances in AI really have propped up growth investing in recent years. This, among other distortions, has resulted in major dispersion for value’s revival in different parts of the globe.
Still plenty of hope for value investing in the UK
VT Momentum Diversified Income co-manager Gary Moglione says that while attention has been on the United States, UK value strategies have quietly outperformed, supported by rising energy prices, inflation, and interest rates. He adds that financials and energy stocks – which are key components of UK indices – have delivered over 100% returns in five years. He believes there is room for this to broaden, particularly further down the market-cap scale.
Fidelity UK Special Values manager Alex Wright says although the FTSE 100 has recently breached the 9,000 barrier, compelling value opportunities remain. He says the fact that UK shares have performed solidly over the past five years has largely gone unnoticed, particularly among domestic investors who continue to withdraw money to allocate overseas. These outflows have characterised the market over the past decade, initially spurred by Brexit-related uncertainty and more recently accelerated by the pursuit of high growth US companies. This created a situation where investors were withdrawing capital precisely when performance improved.
He adds that although large-caps in the UK are trading close to their long-term averages (12.8x forward price-to-earnings), mid and small-caps are still very attractive, with forward earnings of 12.5x and 11.7x respectively^.
“For value investors willing to look beyond the popular narratives and crowded trades, the UK continues to offer a fertile hunting ground. The recent resurgence in buying interest, combined with persistently attractive valuations, suggests this rally may indeed have further to run,” Alex says.
Tom Grady, who is a member of the Schroders value team, which runs the Elite Rated Schroder Income and Schroder Recovery funds, says the opportunities for value are widespread across most UK sectors.
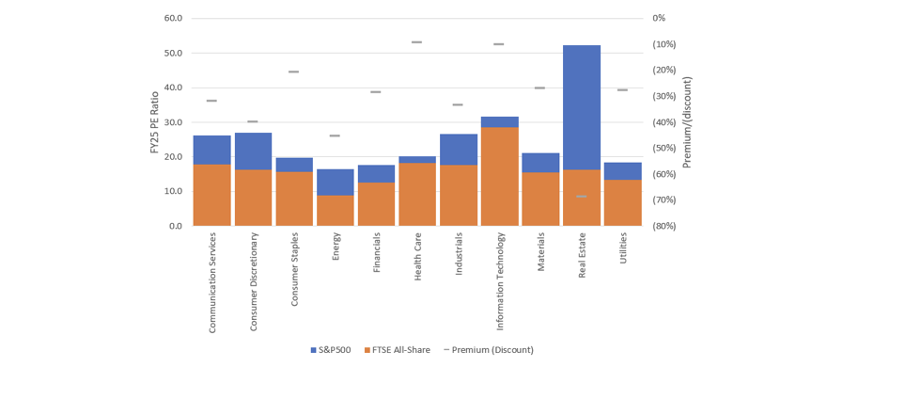
He says MSCI UK has traded at around a 20% discount to its global (and increasingly US-weighted) equivalent. More recently, however, that has widened out to 40%. However, while many commentators believe this is due to the FTSE All-Share being weighted towards banks, oil stocks and miners, this is not necessarily the case^^.
The chart below shows the current PE ratio for each sector in the FTSE All-Share and S&P 500 and the premium/discount) of the FTSE All-Share versus the S&P 500 – and the UK is cheaper across every sector – with an average discount of around 30%^^.
What about other regions across the globe?
Gary Moglione says the dominance of mega-cap growth has masked any value rally in the US. However, he says classic value – represented by the cheapest quintile – still trades at deep discounts, adding that the “opportunity lies in whether these stocks re-rate or growth valuations correct, allowing value to outperform even in a falling market.”
Japan’s value resurgence has been driven by corporate governance reforms, rising shareholder returns and shifting domestic sentiment. “We still see value: companies continue to hold significant cash and are increasingly returning it to shareholders through dividends and buybacks. Activism, once rare, is growing and companies are responding proactively. While the low-hanging fruit may be gone, opportunities remain for those willing to dig deeper,” Gary says.
Like many markets, an extremely wide valuation gap between value and growth stocks has opened up in Europe, creating opportunities. Increased defence spending in Europe could provide a major boost to the continent’s economy in the coming years. Importantly, the effects of rearmament are likely to be felt beyond the defence industry – many of which can be found in the value space.
Examples include banks, which could profit from a broad economic recovery and uptick in lending. Additionally, industrial and materials businesses could stand to gain from both defence and infrastructure spending.
Funds to consider
This fund invests in around 30-60 underlying funds and investment trusts, with a preference for out-of-favour areas. Specialist trusts have been a big part of the portfolio, with holdings in the likes of infrastructure, private equity and biotechnology.
The fund’s philosophy is rooted in the empirical research which has shown that the value style of investing outperforms over the long term. The process begins with a screen of companies for liquidity and low valuations, which leaves them with around 600 stocks. These stocks must have a daily trading value of greater than €4m. The team then screens for companies with high free cash flow yields, low price to book and low forward P/E ratios. The fund is quite concentrated with between 40 and 50 holdings.
Ranmore has delivered excellent returns over a very long time period. Performance has been particularly impressive considering its value style and bias in favour of mid and smaller companies. We think this fund is a hidden gem and should be a big consideration for those looking to add in some value exposure to balance out their portfolios.
*Source: Fidelity, 15 May 2025
**Source: FE Analytics, total returns in pounds sterling, 31 December 2024 to 4 August 2025
***Source: FE Analytics, total returns in pounds sterling, 4 August 2020 to 4 August 2025
****Source: Wellington Management, May 2024
^Source: Fidelity, 30 July 2025
^^Source: Schroders, August 2025
This article is provided for information only. The views of the author and any people quoted are their own and do not constitute financial advice. The content is not intended to be a personal recommendation to buy or sell any fund or trust, or to adopt a particular investment strategy. However, the knowledge that professional analysts have analysed a fund or trust in depth before assigning them a rating can be a valuable additional filter for anyone looking to make their own decisions.Past performance is not a reliable guide to future returns. Market and exchange-rate movements may cause the value of investments to go down as well as up. Yields will fluctuate and so income from investments is variable and not guaranteed. You may not get back the amount originally invested. Tax treatment depends of your individual circumstances and may be subject to change in the future. If you are unsure about the suitability of any investment you should seek professional advice.Whilst FundCalibre provides product information, guidance and fund research we cannot know which of these products or funds, if any, are suitable for your particular circumstances and must leave that judgement to you. Before you make any investment decision, make sure you’re comfortable and fully understand the risks. Further information can be found on Elite Rated funds by simply clicking on the name highlighted in the article.

